
A body composition scale (bathroom scale with body-fat measurement) is either a useful tool or a source of meaningless noise, depending entirely on which one you buy and how you use it. For GLP-1 users specifically, where the goal is losing fat while preserving muscle, having any data on that split is valuable — even if the data isn’t perfect. This is the 2026 UK guide to picking one that gives reasonable readings and avoiding the ones that don’t.
For tracking tools in general see Tracking What Matters in the Complete Guide. For the food scale (which matters more for most users) see Best Food Scale UK 2026.
What body composition scales actually measure
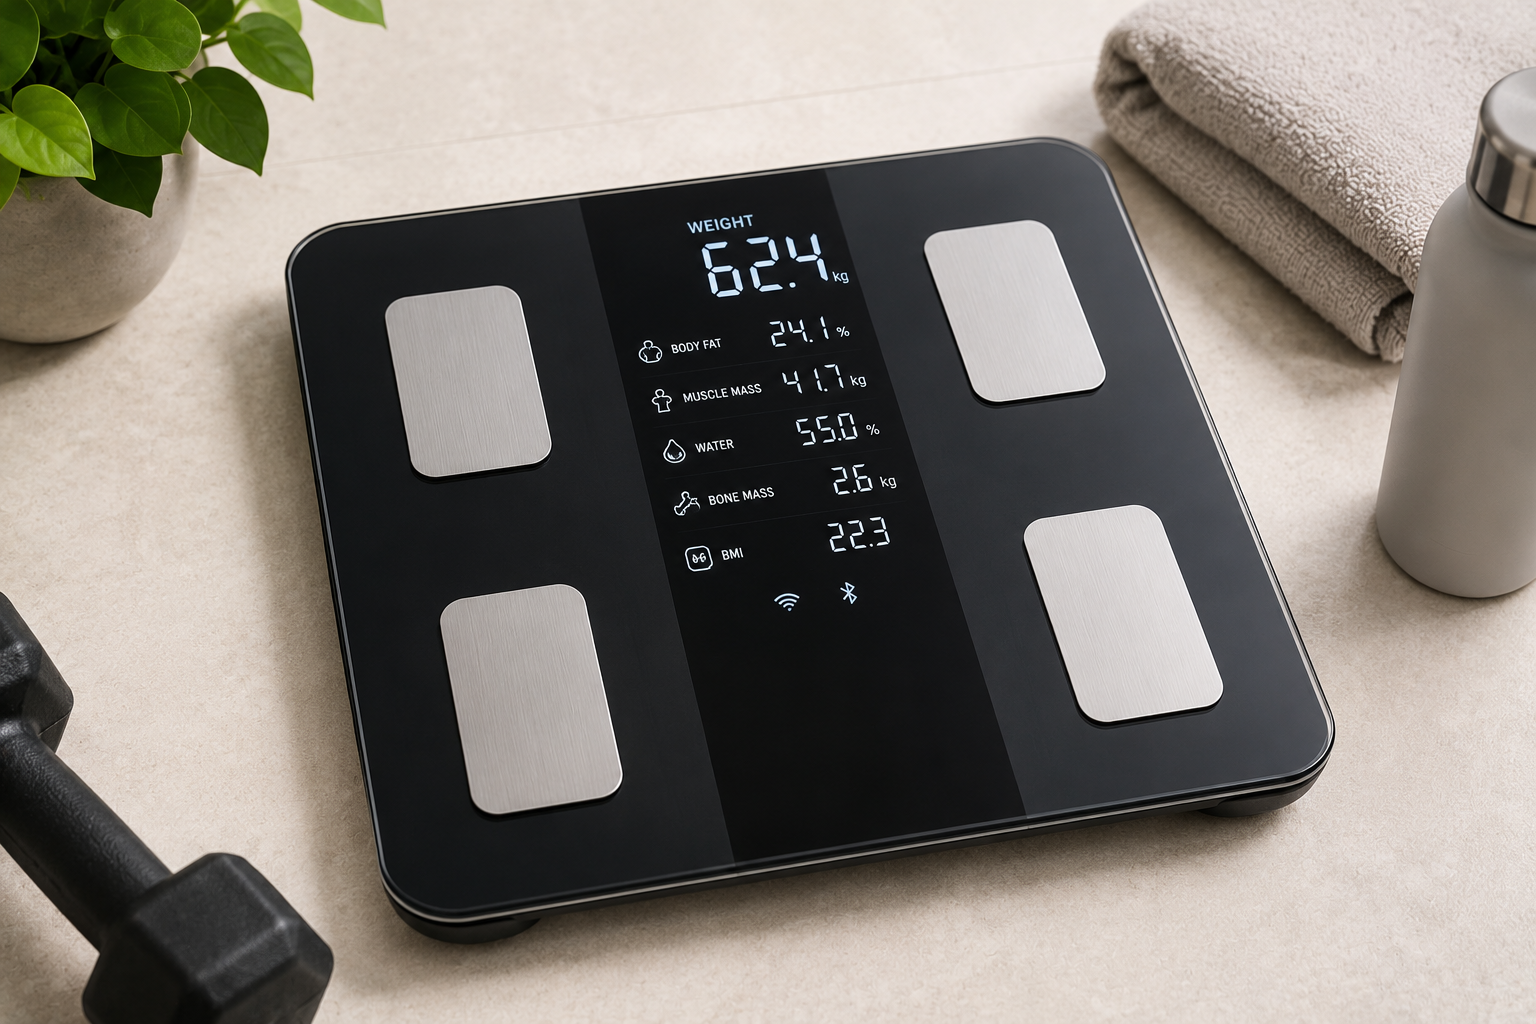
Home body composition scales use a technique called bioelectrical impedance analysis (BIA). A tiny, harmless electrical current passes through your body between the scale’s foot electrodes. Fat tissue conducts electricity differently from muscle and water tissue. The scale measures the resistance (impedance) and uses an algorithm to estimate what percentage of your body weight is fat, muscle, bone, and water.
Key word: estimate. BIA is not direct measurement. The scale is inferring body composition from a single electrical measurement plus your stated height, age, and sex, then applying an algorithm that makes assumptions about the distribution of tissue.
The gold standards for actual body composition are DEXA scans (dual-energy X-ray absorptiometry, available at some NHS hospitals and private clinics for £150–£300) or hydrostatic weighing. Home scales are convenient proxies, not precise measurements.
How accurate are home BIA scales, really?
Honest answer:
Absolute accuracy: moderate at best. Compared to DEXA scans, consumer BIA scales typically show body fat percentage within 3–6 percentage points of actual. That means if your real body fat is 28%, a home scale might tell you 24% or 32%. Not precise.
Trend accuracy: substantially better. If you use the same scale under the same conditions (same time of day, same hydration state, same post-meal timing), the direction of change over weeks is quite reliable. If your scale says you’re at 30% body fat in January and 26% in April, that 4-percentage-point decrease is probably real, even if the absolute numbers are slightly off.
The practical implication: treat body composition scale readings as a trend-tracking tool, not as a precise measurement. Don’t celebrate or panic over week-to-week changes; look at 4-week and 12-week patterns.
Why this matters specifically for GLP-1 users
Two reasons:
1. Weight loss alone doesn’t tell you whether you’re losing fat or muscle. The scale shows weight dropping; the question is “is it the right kind?” Body composition tracking, even imperfect, gives you a directional answer. If your total weight is dropping but your body fat % is steady or rising, you’re losing muscle — which is a signal to increase protein and strength training. If body fat % is falling faster than weight, you’re losing fat at a healthy rate.
2. Muscle preservation is the whole game on a GLP-1. The SURMOUNT trials and other research consistently show that GLP-1-driven weight loss is mostly fat (roughly 60–70%) but also meaningfully muscle (roughly 20–30%). Resistance training and adequate protein bring the muscle loss down. Tracking body composition gives you feedback on whether your interventions are working.
Neither reason requires laboratory-grade precision. They require tracking a trend reliably.
What to look for in a body composition scale
Five features that separate useful scales from decorative ones:
1. Hand-to-foot measurement (not foot-only). The most significant differentiator. Foot-only scales pass current only through the lower body and extrapolate to the whole body. Hand-to-foot scales (with handles or connected sensors) pass current through the whole body, giving better distribution estimates. Hand-to-foot is materially more accurate.
2. Accommodation for multiple users. Most quality scales store up to 8 user profiles, automatically recognising who’s weighing based on body signature. Useful if household members are also tracking.
3. App connectivity. Data recorded over weeks and months is the valuable thing; a scale without any data retention (just a screen display) makes trend-tracking impossible. Bluetooth connection to a companion app is where you get this.
4. Segmental analysis (optional). Premium scales provide separate readings for left arm, right arm, left leg, right leg, trunk. For people specifically tracking asymmetries (injury rehabilitation, targeted training) this matters. For most users, whole-body numbers suffice.
5. Reasonable weight capacity and accuracy. 180kg+ capacity. 0.1kg resolution on the weight display.
Things that matter less: fancy display colours, extremely small “design-forward” form factors that sacrifice functionality, complex metabolic age or “body age” calculations (these are essentially made up).
UK body composition scale picks for 2026
Best all-rounder: Renpho Elis 1 Smart Scale
Foot-to-foot BIA, 13 body metrics, 180kg capacity. Around £25–£35.
Not the most accurate scale on the market but by far the best value in the segment that most users actually need. Renpho’s app (available iOS and Android) is clean and straightforward. Syncs with Apple Health, Google Fit, Fitbit, Samsung Health — important if you’re already tracking elsewhere. Multi-user support via automatic recognition.
The limitation is foot-to-foot BIA which is less accurate than hand-to-foot. But for trend tracking (the actual use case), foot-to-foot works well when you’re consistent with measurement conditions.
For most UK users buying their first body composition scale, this is the correct buy.
Buy from: Renpho Elis 1 Smart Scale on Amazon UK.
Best hand-to-foot: Tanita RD-953 Bluetooth
Hand-to-foot BIA (4C technology), 9 metrics, 200kg capacity. Around £180–£220.
Tanita is the Japanese company that pioneered consumer BIA and supplies medical clinics, gyms, and universities worldwide. The RD-953 uses their hand-to-foot 4C electrode technology — a meaningful step up in accuracy over foot-only scales. The scale itself feels substantially more premium than budget options and the technology has real research backing.
App connectivity, multi-user, segmental analysis on upper body and lower body. Data exports cleanly.
The price is high. Justified if you specifically need better accuracy than foot-only scales deliver, or you’re using the data for something consequential (coaching relationships, athletic training). For most home users, overkill.
Buy from: Tanita RD-953 on Amazon UK.
Best mid-market: Withings Body+ Smart Scale
Foot-to-foot BIA, multi-user, app ecosystem. Around £90–£110.
French brand known for excellent design and software. The Body+ is the middle-ground: better build quality than Renpho, clean app experience, good ecosystem integration (Apple Health, Google Fit, Withings’ own Health Mate app is well-regarded), multi-user. Not hand-to-foot so accuracy is similar to Renpho.
You’re paying for design quality and app polish rather than measurement accuracy. If that matters to you, worth it.
Buy from: Withings Body+ on Amazon UK.
Best premium: InBody Dial H20B
Hand-to-foot BIA, professional-grade technology. Around £200–£280.
InBody is the brand most commercial gyms and healthcare providers use for consumer-facing body composition analysis. The H20B is their home-use consumer product. Hand-to-foot BIA with their proprietary multi-frequency analysis. Well-regarded in the sports science community.
For enthusiastic users who want data closer to clinic-grade, this is the home pick. App support, cloud tracking, multi-user.
Buy from: InBody Dial H20B on Amazon UK.
Best basic smart scale (weight-only, no BIA): Wahoo Smart Scale
Weight-only, app-connected, 200kg capacity. Around £35–£45.
If you decide body composition readings are too noisy to bother with but still want a good app-connected bathroom scale, a weight-only smart scale is a perfectly valid choice. Wahoo’s scale is a reliable, well-built option that syncs cleanly with major health apps.
Honest case for this approach: if you’re weighing weekly, doing monthly photos, and using tape measurements around waist/hips/thigh, a weight scale plus those other data points gives you a complete enough picture without the BIA noise.
Buy from: Wahoo Smart Scale on Amazon UK.
How to actually use a body composition scale
Accuracy depends entirely on consistency. Vary the conditions and the numbers become meaningless. Same conditions every time and the trend becomes meaningful.
The 6 rules of consistent BIA measurement
1. Same time of day. Most people weigh first thing in the morning, which is ideal — after overnight fast, before breakfast, after using the toilet. Do this always.
2. Same hydration state. Don’t weigh right after chugging a litre of water or right after a workout where you’ve sweated. The BIA measurement depends on body water content; wild variation in hydration creates wild variation in readings.
3. Empty bladder and bowels. Before eating or drinking.
4. Same clothing state. Ideally in underwear. Consistent either way.
5. Bare feet, clean feet. The electrodes need skin contact. Dirty or dry-skin feet increase resistance and skew readings.
6. Don’t measure daily. Twice or three times a week is plenty. Daily BIA readings introduce noise without adding signal.
If you get all six right, you’ll have consistent enough readings to see real trends over weeks.
Body composition readings to pay attention to
Scales typically report 10–15 metrics. Most are noise. Three that matter:
1. Body fat percentage. The main number for most users. Trend matters more than absolute value. Aim for a downward trend over 4–12 week windows.
2. Skeletal muscle mass (in kg). The muscle-specific reading. You want this to stay steady or, ideally, increase slightly over weeks on a resistance training programme. A sustained decrease is a signal to increase protein and strength training.
3. Total body water percentage. Normally 50–65% depending on body composition. Dramatic changes here usually indicate hydration shifts rather than real body composition changes — helps you identify when a reading is noise vs signal.
Ignore: “visceral fat rating” (BIA doesn’t measure visceral fat well; you need DEXA or ultrasound), “metabolic age” (essentially made up), “body type assessment” (marketing), “bone mass” (BIA estimates bone mass poorly).
When BIA is particularly unreliable
Some contexts where the readings are especially not to be trusted:
- Dehydration. Morning after a big night out, after heavy sweating, or when genuinely dehydrated — body fat % will read high.
- Fluid retention. Pre-menstrual, after a very salty meal, after long-haul flight — body fat % will read low.
- Recent high-intensity exercise. Muscle microdamage and fluid shifts; wait 24 hours.
- Significant weight changes in the 48 hours before measurement. The algorithm assumes steady-state physiology.
- Pregnancy. BIA is not validated for pregnancy; don’t use the body composition numbers.
- Pacemakers or implanted medical devices. Some manufacturers warn against BIA scales; check your device manufacturer’s guidance.
Pairing the scale with other tracking
Body composition scales are one data source. For a complete tracking picture on a GLP-1:
- Weekly weigh-in (same day, same time)
- Monthly photos (front, side, back, same outfit, same lighting)
- Monthly tape measurements (waist, hips, thigh, upper arm)
- Body composition reading 2–3 times per week
- Strength progression tracking (the weights you’re lifting)
- How clothes fit (an underrated qualitative metric)
- Energy, sleep, mood notes (weekly)
Any single data source is noisy. Together they triangulate to a clearer picture than any one alone.
My recommendation in one line
For most UK GLP-1 users: Renpho Elis 1 Smart Scale for £25–£35. Use it 2–3 times a week under consistent conditions, focus on the 4-week trend in body fat % and muscle mass rather than week-to-week noise, combine with photos and tape measurements.
For the rest of the tracking setup: Tracking What Matters. For the food scale that matters more: Best Food Scale UK 2026.
Disclosure: some links are affiliate links. Note: body composition scales can be counterproductive for people with eating disorder history. Tracking less, not more, may be appropriate for recovery contexts.
Discover more from Healthy Weight Loss GLP1
Subscribe to get the latest posts sent to your email.