
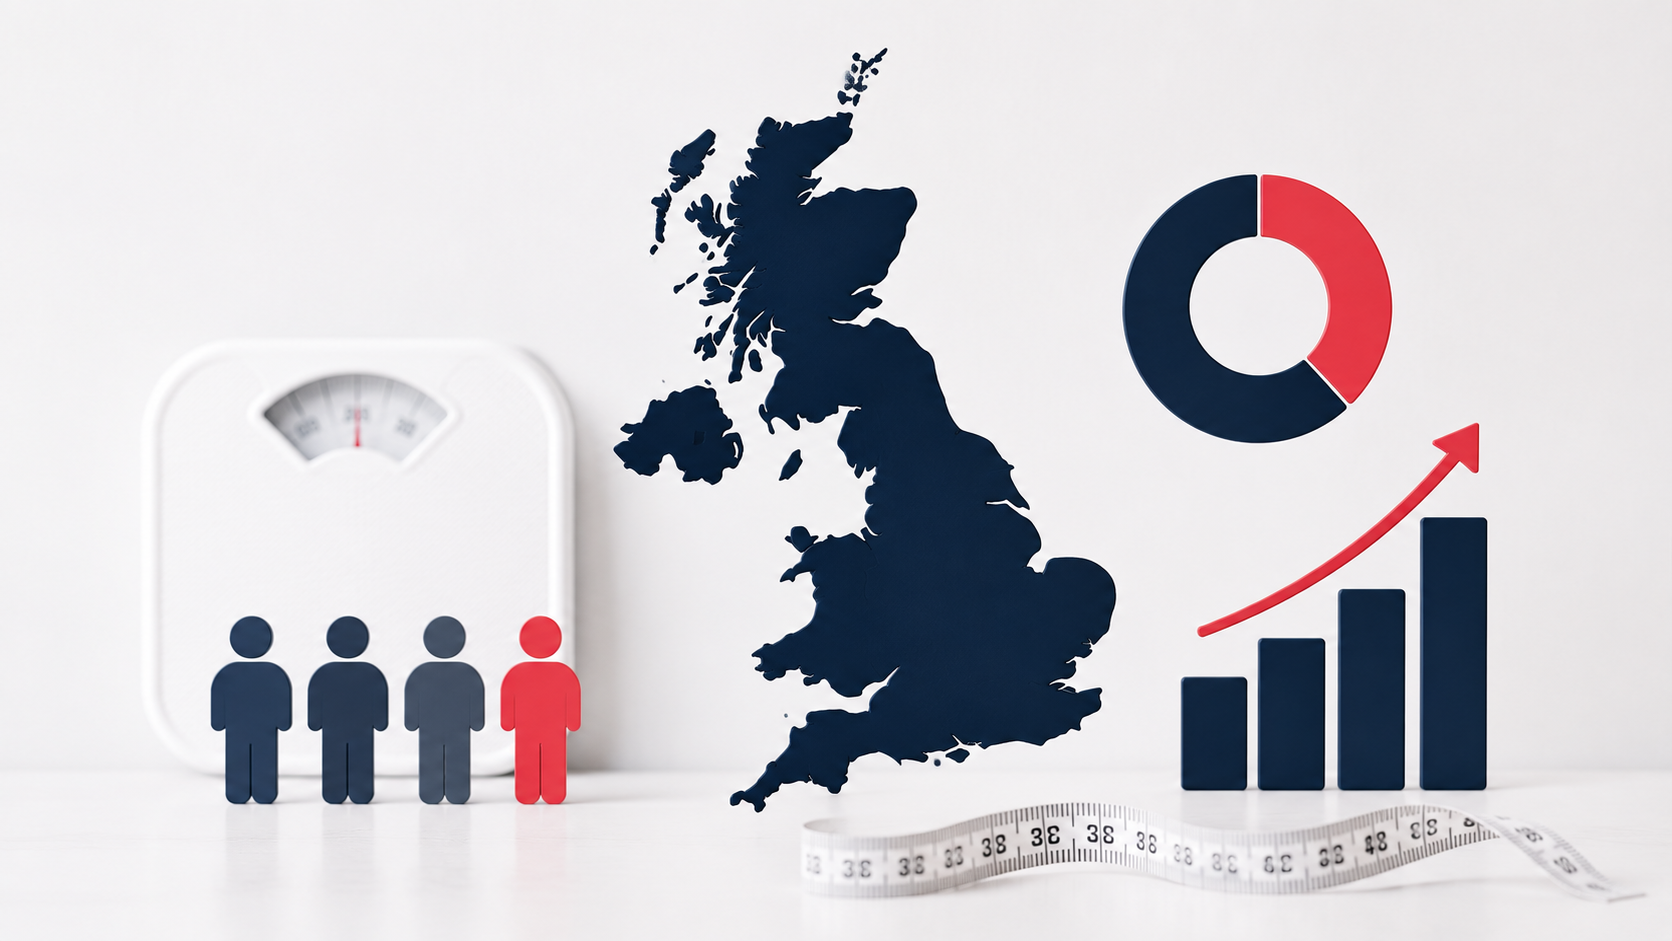
The UK has one of the highest rates of obesity in Western Europe, and the weight loss industry — legal, medical, and predatory — reflects that. These are the most up-to-date UK weight loss statistics available in 2026: obesity prevalence, GLP-1 prescription rates, NHS spending, treatment success rates, and the data that puts your own weight loss journey in context. All figures are sourced and linked. This page is updated annually.
UK obesity statistics 2026
| Metric | Figure | Source |
|---|---|---|
| Adults in England with obesity (BMI 30+) | 28% | NHS Digital / Health Survey for England 2024 |
| Adults in England overweight or obese combined | 64% | Health Survey for England 2024 |
| Children aged 10–11 with obesity (Year 6) | 22.7% | NCMP 2024/25 |
| Obesity-attributable NHS costs annually | ~£6.5 billion | NHS England 2025 |
| Adults in England attempting weight loss in any given year | Estimated 29 million | British Nutrition Foundation |
| UK adults meeting physical activity guidelines | Approximately 67% | Sport England Active Lives 2025 |
| Average UK daily step count | 3,825 steps | Imperial College London 2023 |
The step count figure is striking: the UK average of 3,825 daily steps is well under half of the recommended 8,000–10,000. At an average walking pace, closing that gap with a walking pad adds approximately 2,500 calories of weekly expenditure without a single deliberate exercise session.
GLP-1 medication statistics UK 2026
| Metric | Figure |
|---|---|
| UK adults currently prescribed a GLP-1 medication | Estimated 1.2–1.5 million (2026) |
| Mounjaro NICE approval date (weight management) | December 2024 |
| Average weight loss on tirzepatide (72 weeks, 15mg) | 22.5% of starting body weight |
| Average weight loss on semaglutide (68 weeks, 2.4mg) | 14.9% of starting body weight |
| % achieving 20%+ weight loss on tirzepatide 15mg | 63% |
| Estimated UK private GLP-1 market value (2025) | ~£800 million annually |
| NHS Mounjaro prescriptions (cohort 1, 2025) | Estimated 20,000–30,000 patients |
Weight loss success rates: what the research says
| Method | Average weight lost at 12 months | % maintaining loss at 2 years |
|---|---|---|
| Diet alone (self-managed) | 3–5kg | ~20% |
| Commercial diet programme (WW, Slimming World) | 4–7kg | ~25% |
| NHS behavioural weight management | 3–6kg | ~28% |
| Semaglutide (Wegovy) + lifestyle | 13–16kg | ~40–50% (on continued medication) |
| Tirzepatide (Mounjaro) + lifestyle | 18–25kg | ~50%+ (on continued medication) |
| Bariatric surgery | 30–40kg | ~65–75% |
The maintenance figures for GLP-1 medications drop significantly when medication is stopped without established lifestyle habits — this is why the nutrition tracking, training, and supplement work matters so much during treatment, not after. See Weight Loss Maintenance UK.
Physical activity and weight loss data
| Activity | Calories burned/hour (80kg person) | Steps equivalent |
|---|---|---|
| Walking pad (2km/h) | ~180 kcal | ~2,000 |
| Walking pad (3.5km/h) | ~260 kcal | ~3,500 |
| Brisk outdoor walking | ~300 kcal | ~4,000 |
| Cycling (moderate) | ~480 kcal | N/A |
| Running (8km/h) | ~600 kcal | ~6,500 |
| Resistance training | ~300–400 kcal | N/A |
| Swimming | ~500 kcal | N/A |
For most people, 45 minutes of walking pad use daily burns more calories per week than three formal exercise sessions — simply because adherence to low-intensity daily movement is far higher than adherence to scheduled gym sessions. The WalkingPad range is designed for exactly this use case. See Can a Walking Pad Help You Lose Weight for the full analysis.
The nutrition gap: UK dietary statistics
| Metric | UK average | Recommended |
|---|---|---|
| Daily fibre intake | ~18g | 30g |
| Daily fruit and veg portions | 3.7 | 5+ |
| Daily protein intake (women) | ~60–65g | 45g minimum, 80–100g optimal |
| Daily protein intake (men) | ~80–85g | 56g minimum, 100–130g optimal |
| % UK adults vitamin D deficient | ~20% in winter | 0% |
| % UK adults with low magnesium | ~70%+ | 0% |
These nutritional gaps are present in the general population — on a GLP-1 with 40–60% reduced food volume, they become more pronounced. Tracking in Cronometer identifies which gaps apply to you specifically. The free Lily & Loaf lifestyle analysis translates those gaps into supplement recommendations.
Mental health and weight loss
| Statistic | Figure |
|---|---|
| Adults with obesity reporting depression or anxiety | ~58% |
| Weight loss achieving measurable mood improvement | ~70% of cases |
| GLP-1 users reporting food noise reduction | >80% in real-world surveys |
| Users reporting improved quality of life at 12 months | >75% in SURMOUNT trial data |
The cost of inaction: UK projections
NHS England projects that if current obesity trends continue:
- 40% of UK adults will be clinically obese by 2035
- Annual NHS costs attributable to obesity will exceed £10 billion by 2030
- Productivity losses due to obesity-related ill-health will reach £3.6 billion annually
GLP-1 medications represent the first pharmacological intervention producing weight loss at a scale approaching bariatric surgery. The GLP-1 Weight Loss Injections UK guide covers the full treatment landscape.
Where to go deeper
These statistics give context. The science behind them is explained in depth in several of the best weight loss audiobooks currently available on Audible. Start your free Audible trial and download The Obesity Code to understand the insulin resistance data behind the weight statistics above.
For your own nutritional baseline: Cronometer tracks where your own figures sit against the recommended intakes in the nutrition table above. And if you’re not sure which supplement gaps to address first, the free Lily & Loaf lifestyle analysis cross-references your symptoms against the most common deficiencies and recommends specifically.
Regional variation in UK obesity rates
| Region | Obesity prevalence (adults) |
|---|---|
| North East England | ~33% |
| Yorkshire and Humber | ~31% |
| North West England | ~30% |
| East Midlands | ~29% |
| West Midlands | ~28% |
| East of England | ~26% |
| South West England | ~26% |
| London | ~21% |
| South East England | ~25% |
| Scotland | ~32% |
| Wales | ~30% |
| Northern Ireland | ~28% |
The regional disparity reflects socioeconomic factors, food environment differences, and activity level variation. London’s lower rate correlates with higher average step counts from commuting (tube and walking) and higher average income.
The step-count opportunity
The 3,825 average daily UK step count represents a significant gap from the 8,000 steps associated with meaningful mortality risk reduction. Closing that gap doesn’t require running — it requires making walking easier and more accessible. A walking pad under a standing desk is the most effective structural solution for desk-based workers. For the science behind why steps specifically (rather than gym sessions) are the most reliable weight loss activity: How Many Steps a Day to Lose Weight UK.
The statistics in this post tell a population story. Your individual story depends on which interventions you use and how consistently you use them. Audible’s health library explains the science behind why specific interventions work — The Obesity Code covers the insulin resistance data behind the obesity statistics in detail. Start a free trial and download it today.
And for translating these statistics into personal action — specifically understanding which nutrients your current diet is likely missing — the free Lily & Loaf lifestyle analysis gives a personalised picture based on your symptoms and diet patterns, not population averages.
How these statistics compare internationally
| Country | Obesity rate (adults) | GLP-1 adoption |
|---|---|---|
| USA | ~43% | Highest globally |
| UK | ~28% | Rapidly growing |
| Germany | ~24% | Moderate |
| France | ~21% | Lower than UK |
| Japan | ~5% | Low overall |
The UK’s obesity rate — while significantly lower than the USA — represents the highest in Western Europe alongside Malta and Turkey. This is the public health context behind NICE’s decision to approve and begin NHS rollout of GLP-1 medications. For the full regulatory picture: Can I Get Mounjaro on the NHS UK.
Frequently asked questions
How many people are on Mounjaro in the UK?
Estimated 300,000–500,000 private prescriptions as of mid-2026, with NHS prescribing adding 20,000–30,000 through Cohort 1. The total GLP-1 population in the UK (including Wegovy, Ozempic for diabetes, and Saxenda) is estimated at 1.2–1.5 million.
Is the UK obesity rate improving?
No — prevalence continued rising through 2024 despite public health campaigns. GLP-1 medication adoption at scale may represent the first intervention capable of reversing population-level obesity trends, but this will take a decade to appear in statistics.
The GLP-1 impact on UK statistics: what to expect
Epidemiologists and NHS planners are watching the GLP-1 adoption curve carefully. If the 1.2–1.5 million current UK GLP-1 users achieve clinical-trial-level weight loss (15–22% of starting body weight), the downstream effects on NHS statistics should become measurable by 2027–2028 in:
- Type 2 diabetes incidence rates
- Knee and hip replacement waiting lists
- Sleep apnea CPAP prescriptions
- Cardiovascular event rates in the 50–70 age group
- Blood pressure medication prescriptions
The statistical impact is expected to lag treatment adoption by 3–5 years because obesity-related conditions take years to develop and years to reverse. The 2030 statistics will be the first meaningful signal of whether population-level GLP-1 adoption has shifted the curve.
For the individual user, these population statistics are context. Your weight, your health markers, and your trajectory are what matter. The tools to track yours: Cronometer for nutrition, the Lily & Loaf lifestyle analysis for supplement gaps, and Audible for the science behind the statistics. All free to start.
Alan’s own journey reflects these statistics closely: starting at 27 stone — well above the obesity class III threshold — and losing 7 stone over 12 months. That’s a 26% reduction in starting body weight, at the upper end of the tirzepatide clinical trial range. Every element of the supporting toolkit (protein tracking, resistance training, walking pad for daily steps, supplement foundation) is documented week by week on the YouTube channel. The statistics tell the population story; the channel tells the individual one.
Discover more from Healthy Weight Loss GLP1
Subscribe to get the latest posts sent to your email.